SFO Workforce Diversity Data for 2020-21
Introduction
The SFO is required under Section 149 of the Equality Act 2010 (the Public sector Equality Duty) and the Equality Act 2010 (Specific Duties) Regulations 2011 to publish information that demonstrates our compliance with the general equality duty with regard to age, disability, ethnicity and gender. In addition to these statutory categories, we also monitor our workforce with regard to religious belief, sexual orientation, and part-time working.
Structure of the report
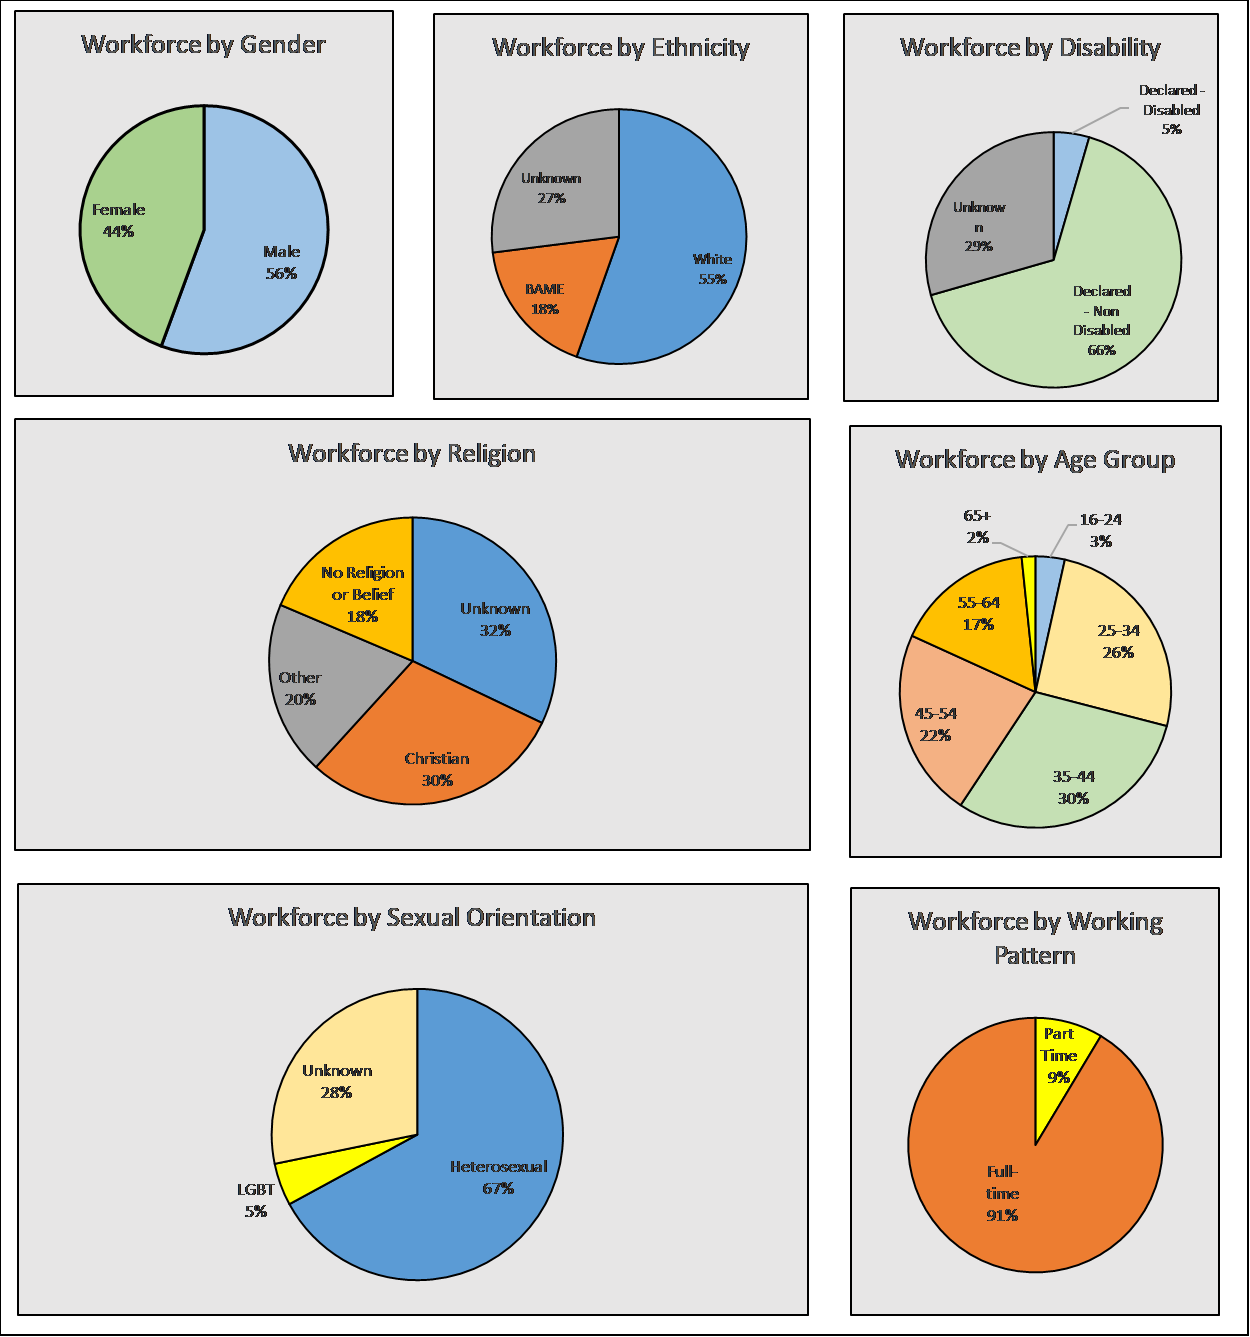
This document provides summary profiles of our workforce by ethnicity, gender, religious belief, age, sexual orientation, disability and part-time workers as at 31 March 2021.
It also shows the diversity of our workforce in key areas within a typical employment cycle covering the 12 months between 1 April 2020 and 31 March 2021. The elements of the typical employment cycle for which workforce diversity data is provided are:
- Promotions
- Temporary promotions
- Appointments
- Exits
- Annual Bonuses
- In Year Bonuses
In publishing Diversity data, the SFO is mindful of the need to ensure that we comply with ONS guidelines and Civil Service best practice guidance on the monitoring of equality and diversity in employment. These guidelines prevent us from publishing any data which runs the risk of disclosing an individual’s personal sensitive information. This is defined as any data where the numbers are less than 5.
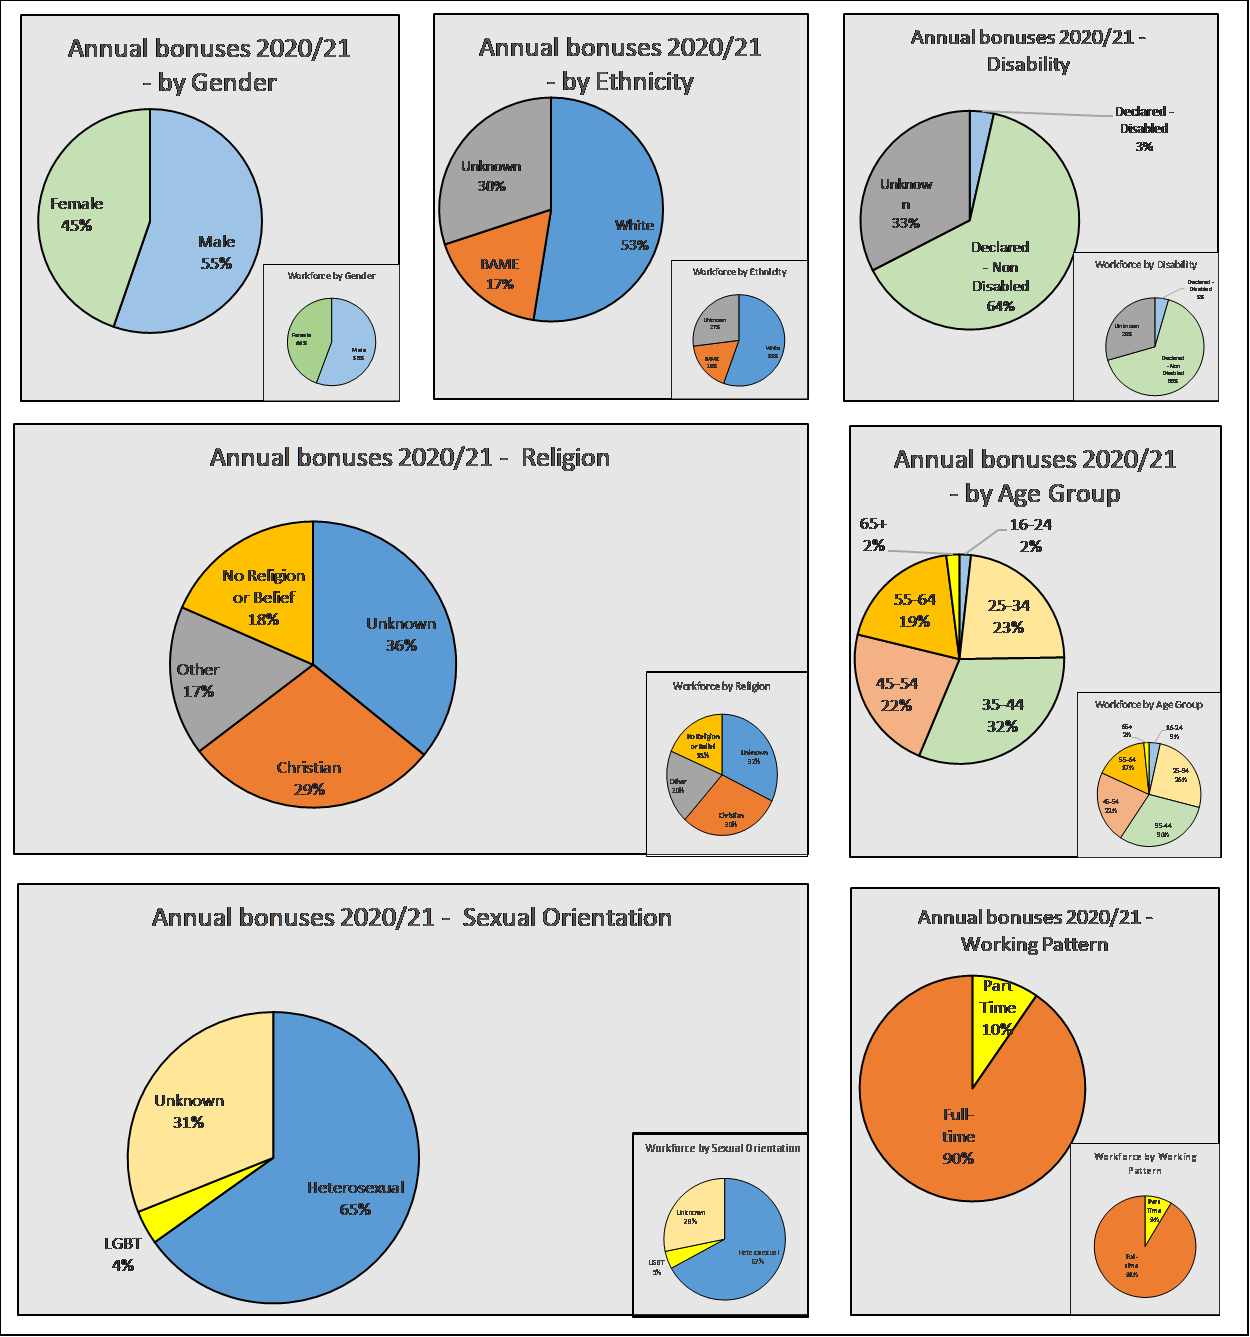
The data is therefore presented as percentages to ensure that publication does not run the risk of disclosing an individual’s personal sensitive information. By publishing the data in percentage terms we are able to make comparisons in relation to all the areas covered, between the proportion of each demographic in the total workforce and the proportion being promoted and rewarded. For example, our data shows that staff declaring themselves as BME make up 18% of the total SFO workforce and that 17% of those receiving an Annual Bonus were from a BME background.
Declaration Rates
We ask all our employees to use our on-line self-service HR system to tell us their disability status, their ethnicity, their religion or belief and their sexual orientation. For each of these areas they have the option of ‘Prefer not to say’. This option is combined with blank fields and are shown as Not known in the charts. As at 31 March 2021, the percentage of Unknown data ranged between 20% - 29% of the total. This is an improvement on previous years due in part to an exercise to improve the voluntary declaration rate that was undertaken in Nov 2018 and also following changes and improvements made to the collection rate via the on-boarding process for new recruits.
The SFO recognises the need to increase employee diversity data through self reporting and we have an ongoing campaign to raise awareness amongst employees, including messages supported by our Board level Diversity Champions.
Issues
A set of pie charts are attached to this report to help illustrate the following points.
Ethnicity
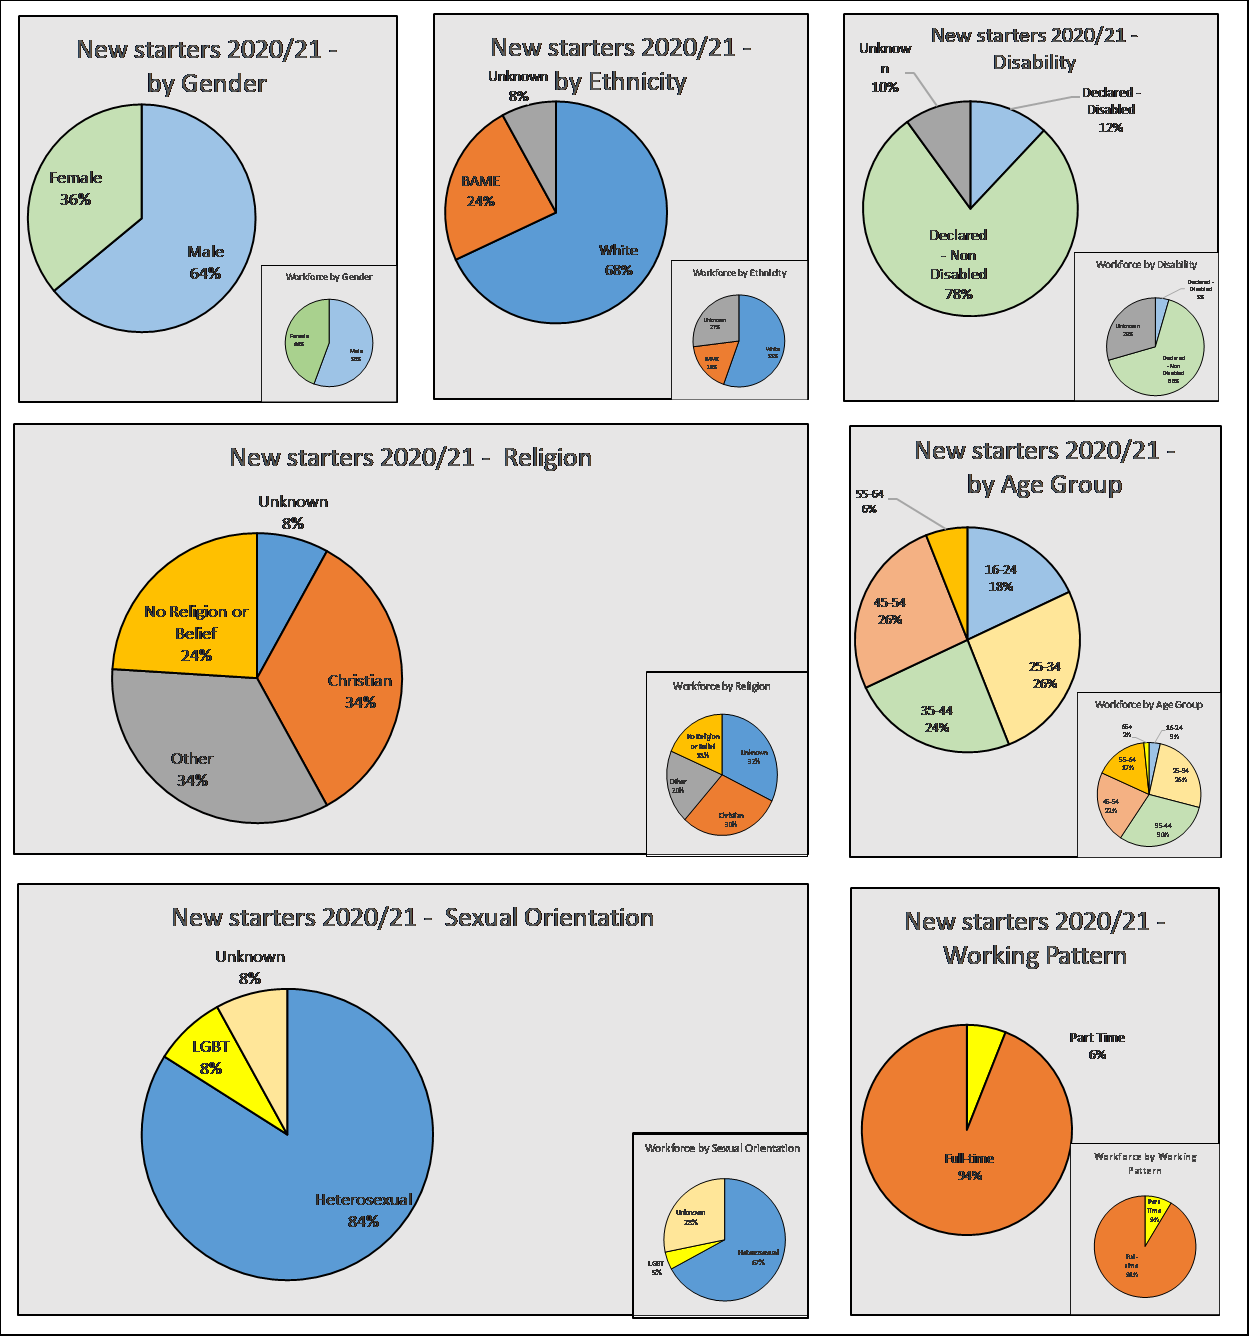
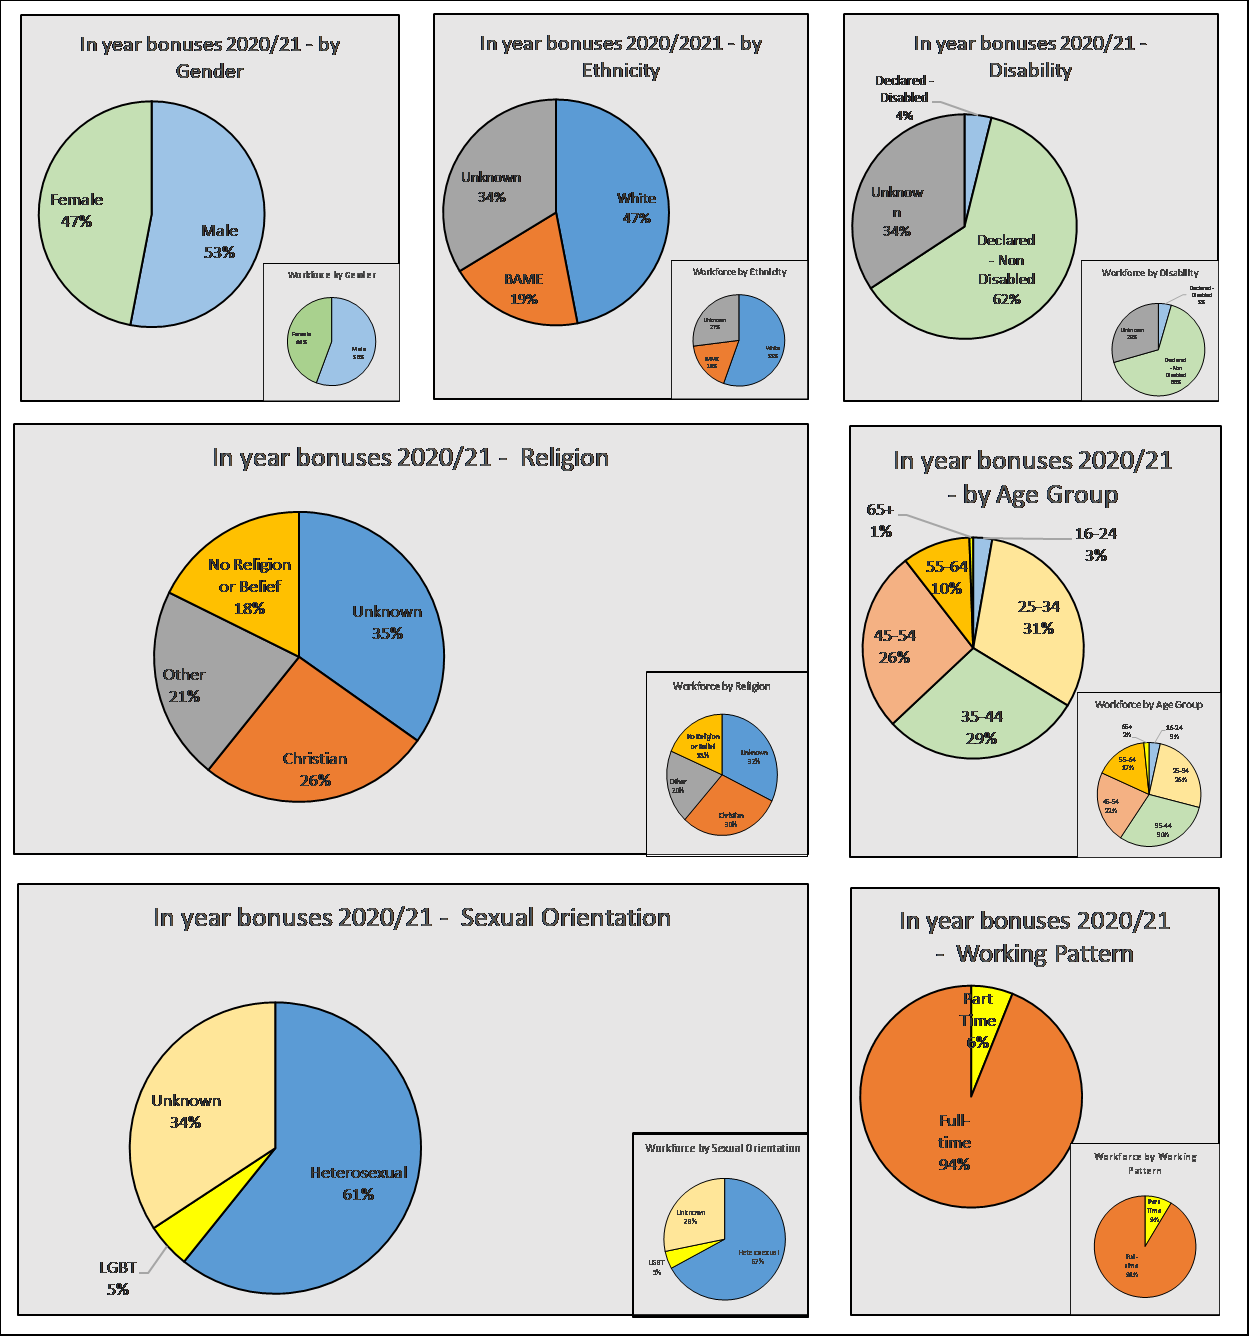
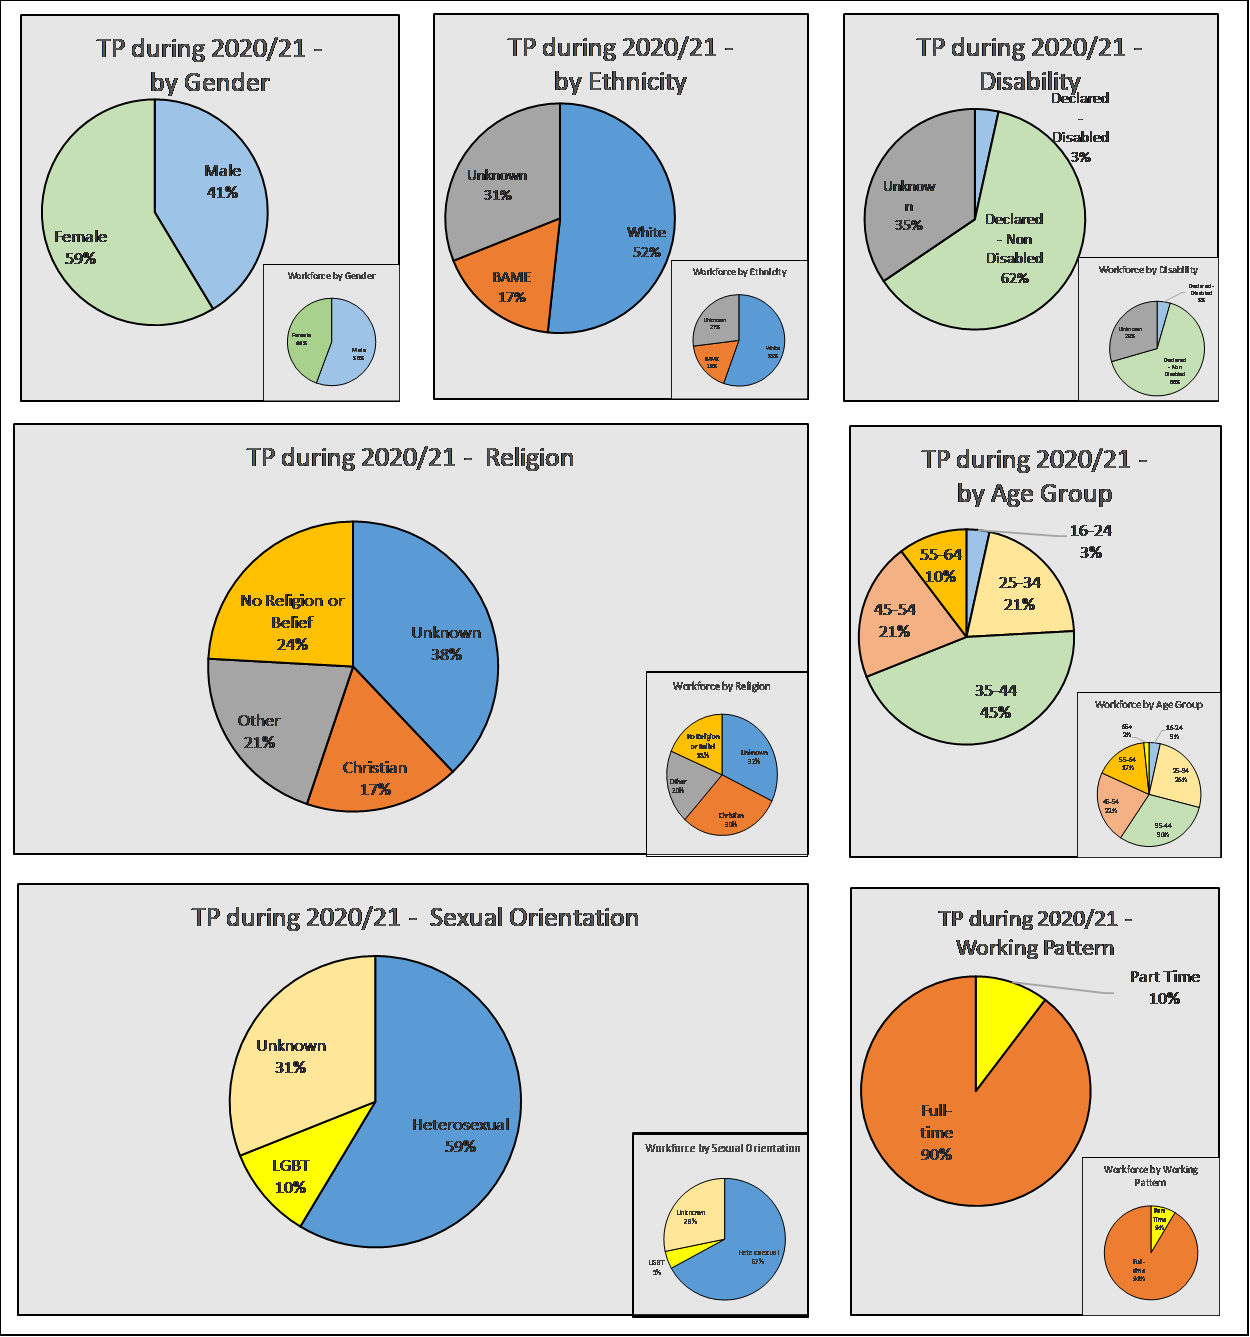
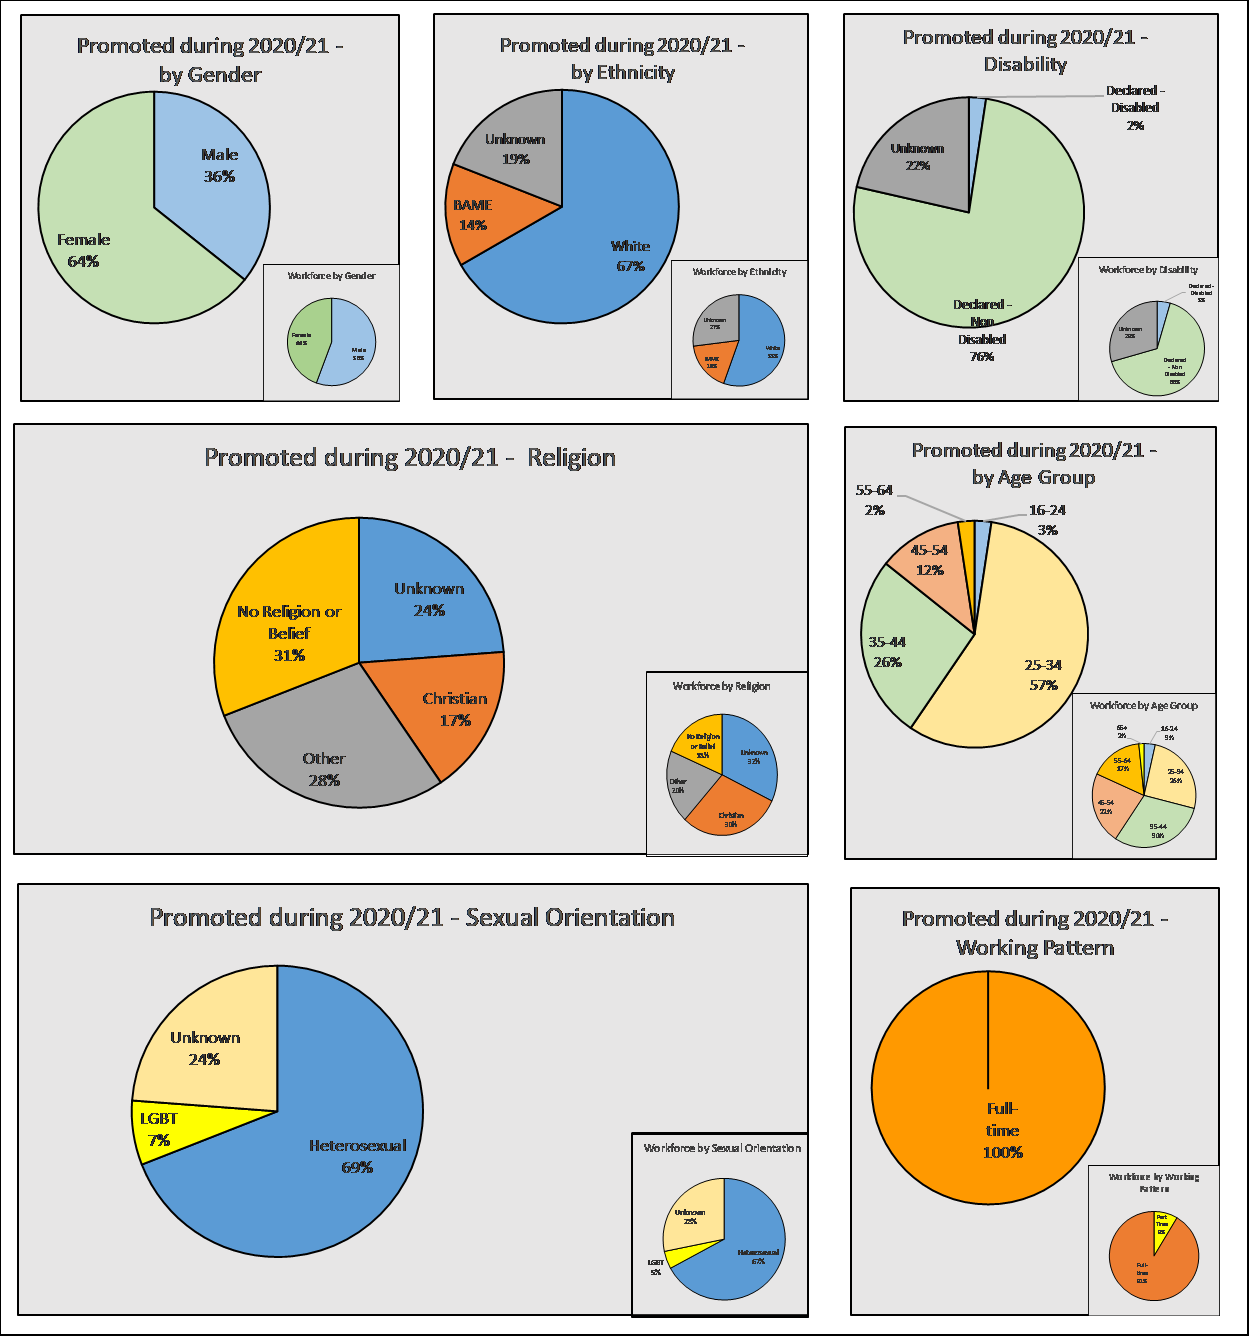
The percentage of declared BME staff now stands at 18% - a slight increase on previous years, which is partly down to an improvement of recorded data (now reduced to 27% unknown) but also a continued increase in the number of Asian staff (now at 45, up from 40). The figure now compares well with the UK civil service figure of 14.3%[1] (which also has 18% not declared/reported). 24% of new starters to the SFO declared as BME , and just 8% remain unknown (a continued significant improvement on the 73%, 43% and 17% that remained unknown from the starters in the previous three years). BME staff received 19% of in-year bonuses and, 12% of Outstanding markings were to staff who had declared their ethnicity as BME. Statistically BME staff equally likely to receive a Temporary Promotion (17%), or to be permanently promoted (14%).
Gender
The percentage of Female staff in the SFO workforce stands at 44%, which is slightly less than previous years. This remains below the UK civil service figures which is at 54%. 28.5% of Female staff received an Outstanding assessment, around 3% more than Male staff (similar to last year). Throughout most of the other categories (bonus payment, promotions etc.), the percentage of female staff remains in line with, or above, the workforce.
Religious Belief
The percentage of unknown respondents has decreased since the previous year and is now at 27%, which is due to increased amount of data being received from new starters. However the overall figures for declared individual religions are mostly similar to 2020.
Age
The SFO’s workforce remains fairly evenly split in the main age groups. This is also reflected in the ages of new starters, although 16-24 group provides more new starters than the other groups when compared to the overall workforce.
Sexual Orientation
Declaration rates for LGBT staff have increased over the last 12 months, but the overall figure of 4.7% declaring as LGBT is almost identical to last year. Overall the Civil Service figure has now increased to 5.6%.
Disability
The declaration rate of 4.5% is an increase from the previous year, but remains well below the civil service level of 13.6%
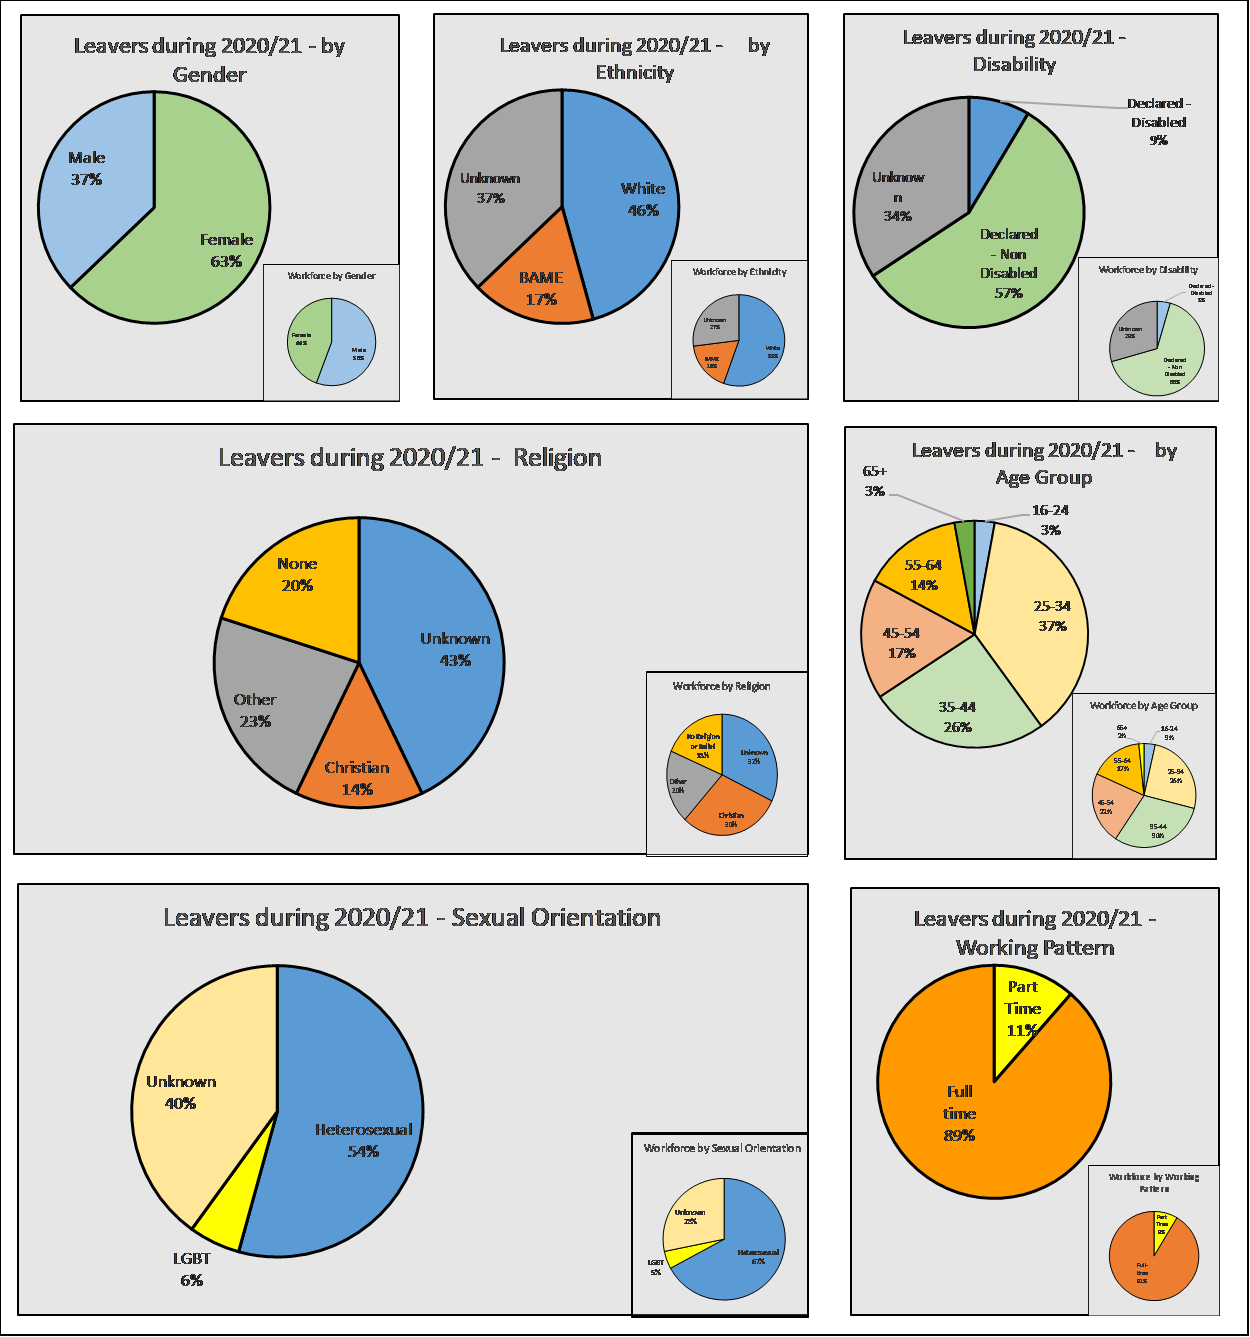
Leavers
When compared to the current staffing levels, a higher proportion of leavers were Female (63%). A slightly higher level of leavers were in the 25-34 age bracket, but other categories showed similar percentages to the overall proportion of the workforce, although there was a higher number of unknown ethnicities.
Main Figures:
[1] UK civil service stats are as at 31 March 2021, as published on the gov.uk website.
Starters charts (with full workforce charts inset)
Bonus charts (with full workforce charts inset)
Performance Bonus charts (with full workforce charts inset)
Temporary Promotion charts (with full workforce charts inset)
Permanent Promotion charts (with full workforce charts inset)
Leavers charts (with full workforce charts inset)